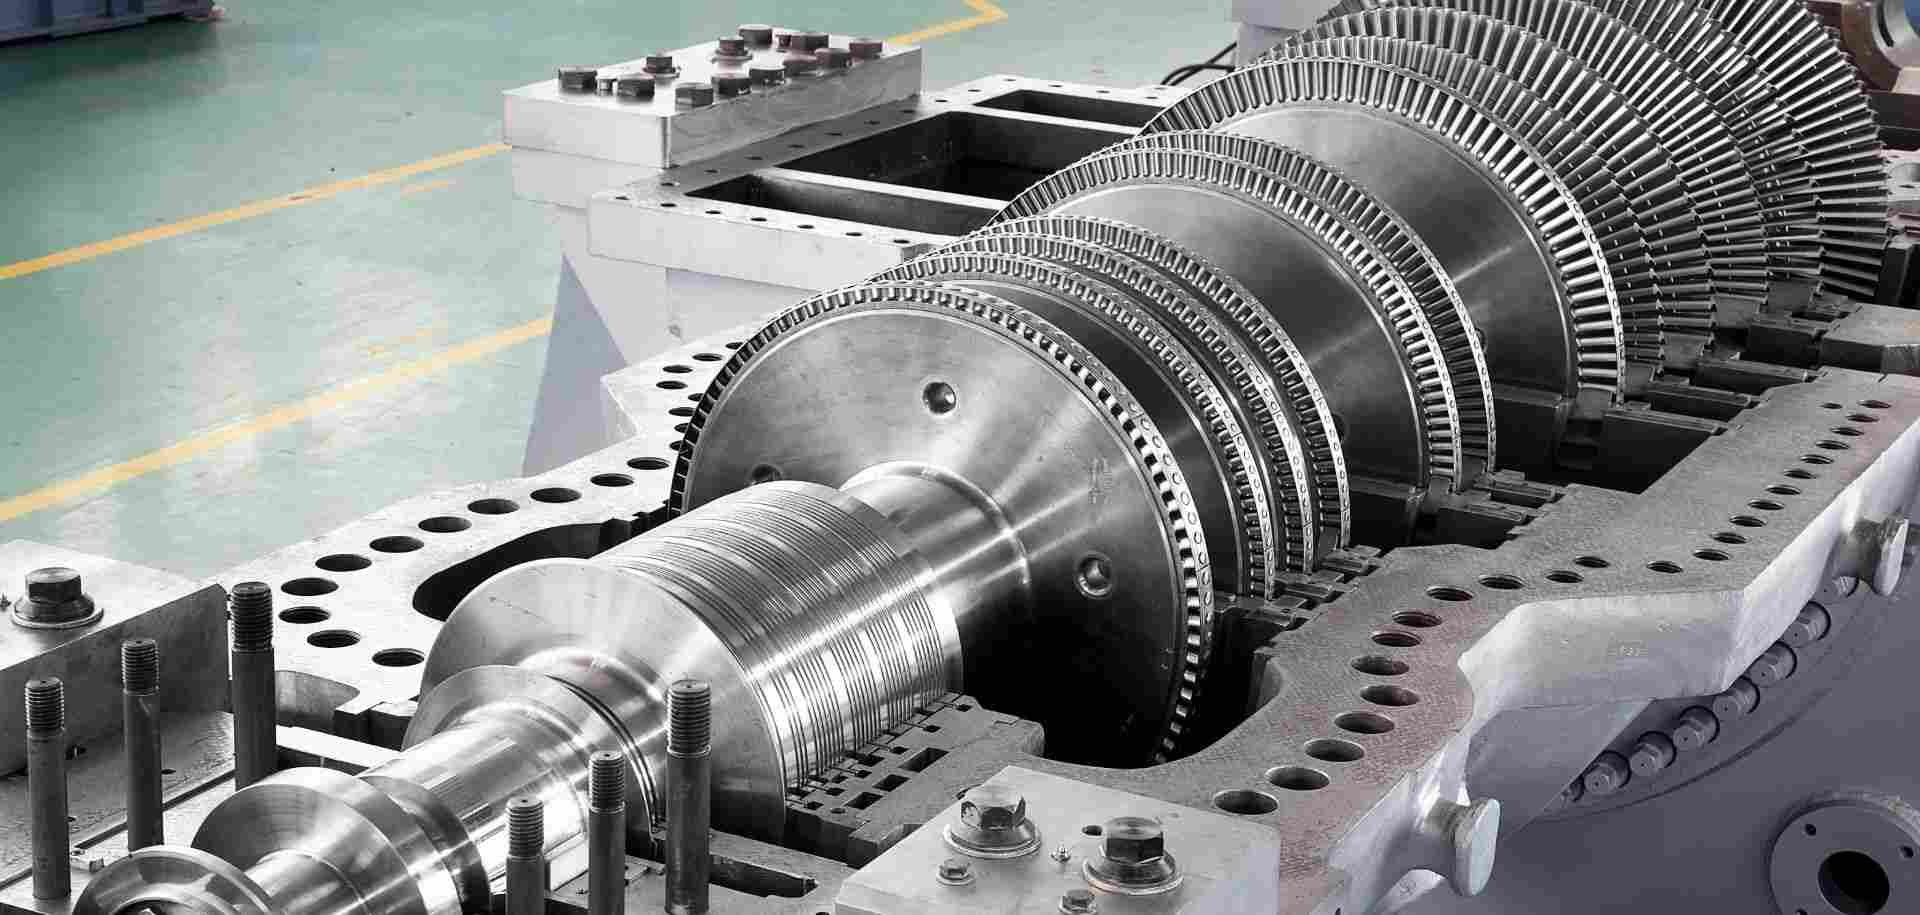
Triveni Turbine Limited (TTL) is a leading industrial steam turbine manufacturer based in Bengaluru, India. With over five decades of experience, the company specializes in designing and producing steam turbines with capacities up to 100 megawatts electric (MWe) for power generation and combined heat and power applications across various industries.
Key Highlights:
- Global Presence: TTL has supplied over 6,000 steam turbines across 20 industries in more than 80 countries, including regions like Europe, Africa, Central and Latin America, Southeast Asia, and South Asian Association for Regional Cooperation (SAARC) countries.
- Product Range: The company's offerings include back-pressure turbines, condensing turbines, American Petroleum Institute (API) compliant steam turbines, and SMART turbines designed for pressure reduction and desuperheating applications.
- Aftermarket Services: TTL provides comprehensive services such as predictive and preventive maintenance, troubleshooting, health check-ups, balance of plant solutions, turnkey solutions, automation, restoration, upgradation, original equipment manufacturer (OEM) services, modification and conversion packages, high-speed balancing, remote monitoring, and training programs.
- Financial Performance: As of March 12, 2025, TTL's market capitalization stands at approximately ₹16,865 crore. The company boasts a return on equity (ROE) of 28.91%, an earnings per share (EPS) of ₹10.67, and a debt-to-equity ratio of 0.01, indicating a strong financial position with minimal debt.
- Manufacturing Facilities: TTL operates state-of-the-art manufacturing facilities in Bengaluru, Karnataka, ensuring high-quality production standards.
TTL's commitment to innovation and excellence has positioned it as a trusted name in the industrial steam turbine sector, catering to diverse industries such as sugar, cement, steel, chemical, petrochemical, and fertilizer sectors.
Triveni Turbine Limited Technical Analysis
- Market Cap: 16,425 Cr., a mid cap company.
- Total no. of shares: 31.7 Cr. and Total no. of shareholders is: 1.49 Lakh
- Sector: Capital Goods | Industry: Engineering - Industrial Equipments
- Face value: 1
- Current Price: 517
- High/Low: 885/444
- EPS: 10.67, Earning per share is increasing quarter on quarter. From Dec 2023 to Dec 2024, EPS is in an increasing state, which is a good sign that the company's earnings are in progress.
- PE Ratio: 48.45, the market price is 48 times as compared to Earning Per Share, which is a sign of neither undervalued nor overvalued. PE ratio is decreased from 89.76 to 48.45, which shows correction happened in stock price and we see its EPS is increasing, which is a good sigh of buying oppertunity
- Book Value Per Share: 34.3
- PB Ratio: 15.16, the market price is 15 times as compared to Book Value Per Share, which means the market price is very high as compared to its actual assets. PB ratio has been decreasing day by day, from 27.65 to 15.16, which is a good sign of correction.
- Sector PE: 81.19 and its PE is 48.45, which shows its market price is overvalued.
- ROCE: 38.3%, this is a fantastic return, which shows that the company is utilising its capital and current liabilities to generate 38.3% of operating profit.
- ROE: 28.5%, Return On Equity is also good, this shows the company is generating a good net profit using shareholders' capital.
- Company is almost debt free. Company has delivered good profit growth of 20.1% CAGR over last 5 years
- Stock is trading at 15.2 times its book value. Promoter holding has decreased over last 3 years: -11.9%
Now Let's see Triveni's Profit and Loss statements
- Sales of Triveni are increasing every quarter. From Dec 2021 to Dec 2024, it was in an increasing state only. Year on year sales are increasing, Currently Dec 2024 is 503 Cr. and in Dec 2023 it was 432 Cr. increament of 71 Cr.
- Company has tried to maintain its expense with respect to sales on every quarter.
- Operating Profit is increasing every quarter, which is a good sign of ROCE. Operating Profit Margin is stable since Dec 2021 and slightly increased from June 2024 quarter. The company has other income, which is adding to the profit.
- Good thing is this company is debt free, so Triveni can focus on productivity.
- Depreciation is concerning, but if we look at what the company's products are, then it is normal. This type of product and the machine they use to create those products may depreciate.
- Company is paying taxes on a continuous basis. Net profit is in an increasing state every quarter. Financial year 2024 profit was 269 Cr. and currently this year profit is 264 Cr. where March result is yet to come. If the profit continues, then it may cross 300 Cr. The Company is also giving a dividend.
Balance Sheet
- Triveni has an equity capital of 32 Cr. which they have maintained consistently from March 2023.
- Company is making profit and so Reserves are increasing every year. March 2013 was 102 and March 2024 is 928 Cr.
- Borrowings are negligible as they have only lease liabilities of around 10 Cr.
- Other Liabilities is also fine, Trade Payables is 239 Cr. and Other Liabilities items are 550 Cr. This is not a major concern.
Let's check Trivinei Cash Flows
- Company is generating cash from its operation activity consistently, which is a good sign that the company has the ability to generate more profit in the future. Trade Receivables is yet to come which can also add wealth in future.
- Their investment activity is also good. Their main focus of investment is on items.
- And if we talk about Financing activity, this is very much fantastic because the company is fully debt free and they are giving dividend to their shareholder.
Shareholding Pattern
Shareholding pattern is very mind blowing with 55.84% Promoters, 28.34% of FIIs, 10.92% of DIIs, and only 4.90% of Public. Recently we know that FIIs are selling but they are purchasing this stock every quarter which is a good sign.
Understanding Triveni Turbine Ltd. Chart - Weekly

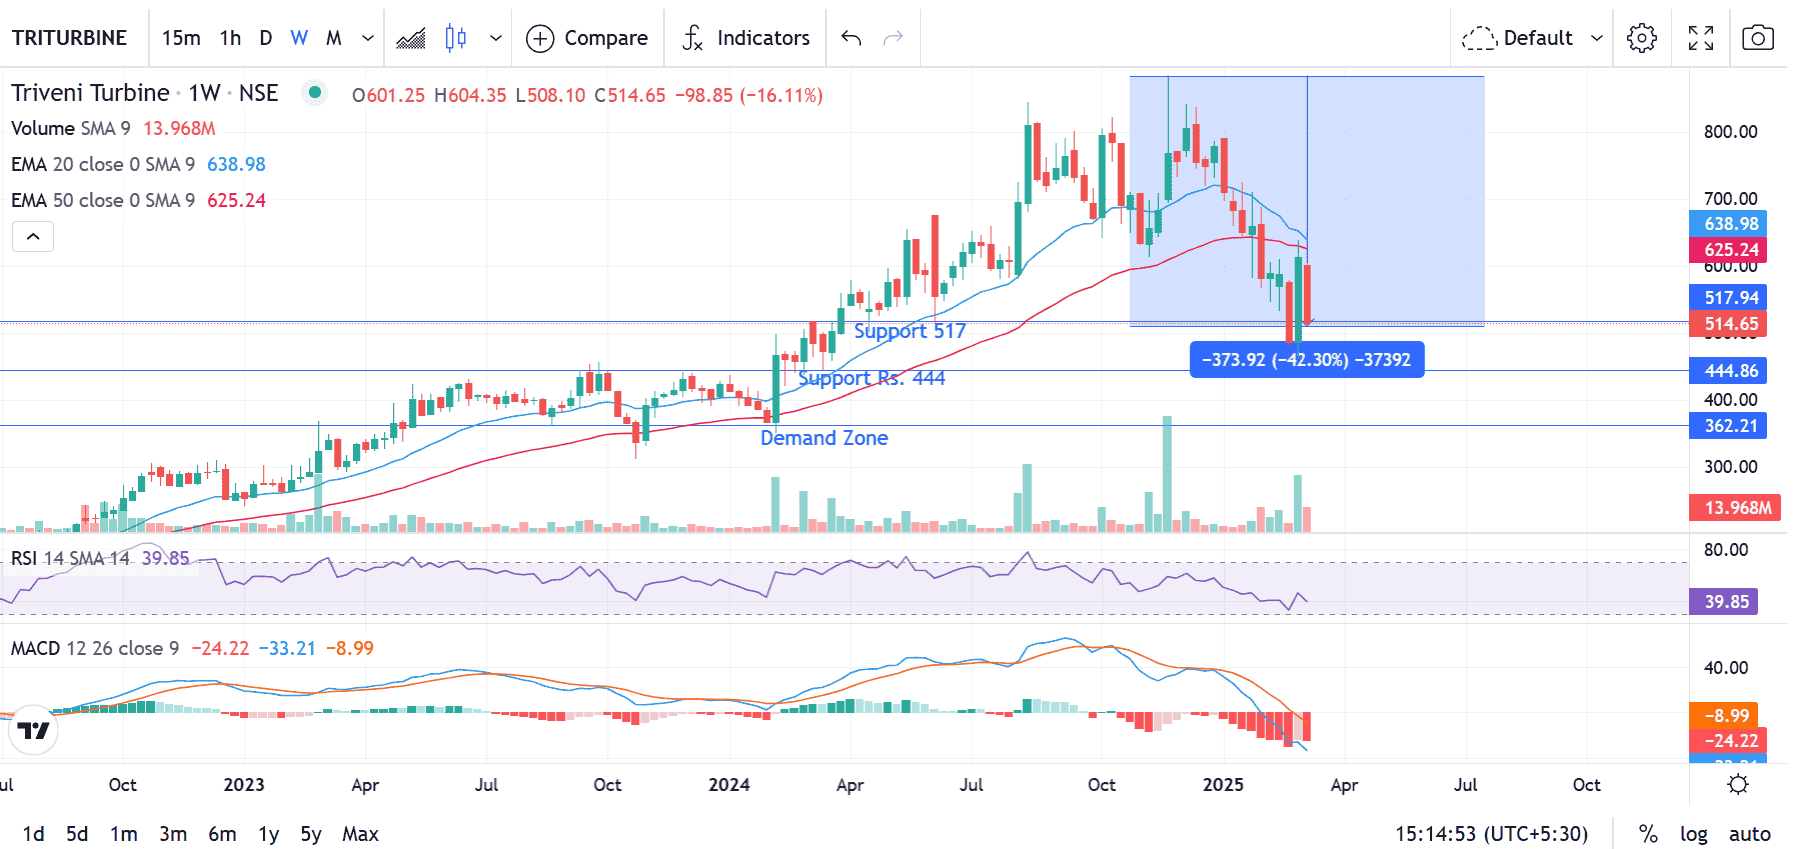
- The RSI is 39.75 which is showing the stock is neither undervalued nor overvalued. And the RSI graph is reflecting that the stock may fall more.
- In MACD graph, the blue line signifies that there is still a selling pressure as it is below the signal line (orange color).
- Currently there are two support zones at Rs. 517 and Rs. 444, Rs. 517 is already tested twice, if this becomes weak then it may test Rs. 444.
- According to the current market condition and by looking at the graph, there is still a selling pressure in this stock. Current candle is in big marubouzu condition, which signifies more selling pressure.
- Previous week, which was from 3 March, the buyers were trying to buy the shares above Rs. 444, which is a second support zone. But this week the seller ruled it.
- Previous demand zone was Rs. 362 i.e from 5 Feb 2024, please refer to the above image. After its peak, it fell down by 43% approx, which shows the correction in the stock due to market condition, and also the stock was overbought and overvalued.
Conclusion
This is a very good stock and should track on a regular basis. After finding the good demand zone and checking the company's order book, the future perspective and the technology advancement, we can consider this. Thank you.
Note: Investments are subject to market risk, please check your risk.

